

U.S. Treasury yields surged to their highest level since November 2023, driven by a robust 256,000 job gain in December that far exceeded expectations of 160,000. This yield spike, fueled by resilient labor market strength and hawkish Federal Reserve commentary, overshadowed equity market declines led by small caps. While the labor market signals economic momentum, persistent inflationary pressures suggest rates could stay elevated, shaping a challenging investment landscape in early 2025.
⏱️ Global Markets in 10 Seconds:
🇺🇸 +256K Jobs push Treasury yields to 2023 highs 📈
🇪🇺 2.4% Inflation sparks ECB rate cut debates 🎯
🇨🇦 6.7% Unemployment dips as labor market rebounds 💼
🇨🇳 52.2 Services PMI rises amid deflation risks ⚠️
🇯🇵 1.19% JGB Yield hits highest since 2011 📉
🔍 The Big Picture
Global markets delivered a complex picture this week, with stronger labor data in developed economies fueling higher yields, while inflation dynamics continue to diverge across regions. Emerging markets offered contrasting narratives, underscoring persistent challenges and pockets of resilience.
United States: +256K Jobs smashed expectations, driving Treasury yields to the highest level since late 2023. While this underscores labor market strength, wage growth of 3.9% YoY points to inflationary pressures, supporting the Fed’s cautious tone on rate cuts in 2025.
International: Eurozone inflation accelerated to 2.4%, with Germany leading the charge at 2.8%, even as retail sales slowed. This complicates the ECB’s rate-cut timeline, as policymakers navigate growth risks and sticky core inflation of 2.7%.
Emerging Markets: China’s 52.2 Services PMI highlights a domestic demand recovery, but deflation looms with CPI at 0.1% YoY. Meanwhile, India’s growth momentum softened, with projected GDP growth of 6.4%, the slowest pace in three years, raising concerns about regional headwinds.
⭐️ Post of the week
This week, Aswath Damodaran, a professor of finance at NYU Stern and a globally respected authority on valuation, shared his annual data update for 2025. More than just a collection of numbers, Damodaran’s update serves as both a powerful tool for challenging assumptions and a warning about the pitfalls of data misuse. For decades, his work has been a go-to resource for investors and analysts navigating the complexities of corporate finance and market valuation.
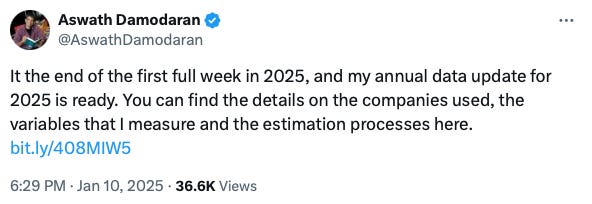
Source: Aswath Damodaran - X
Why This Analysis Matters
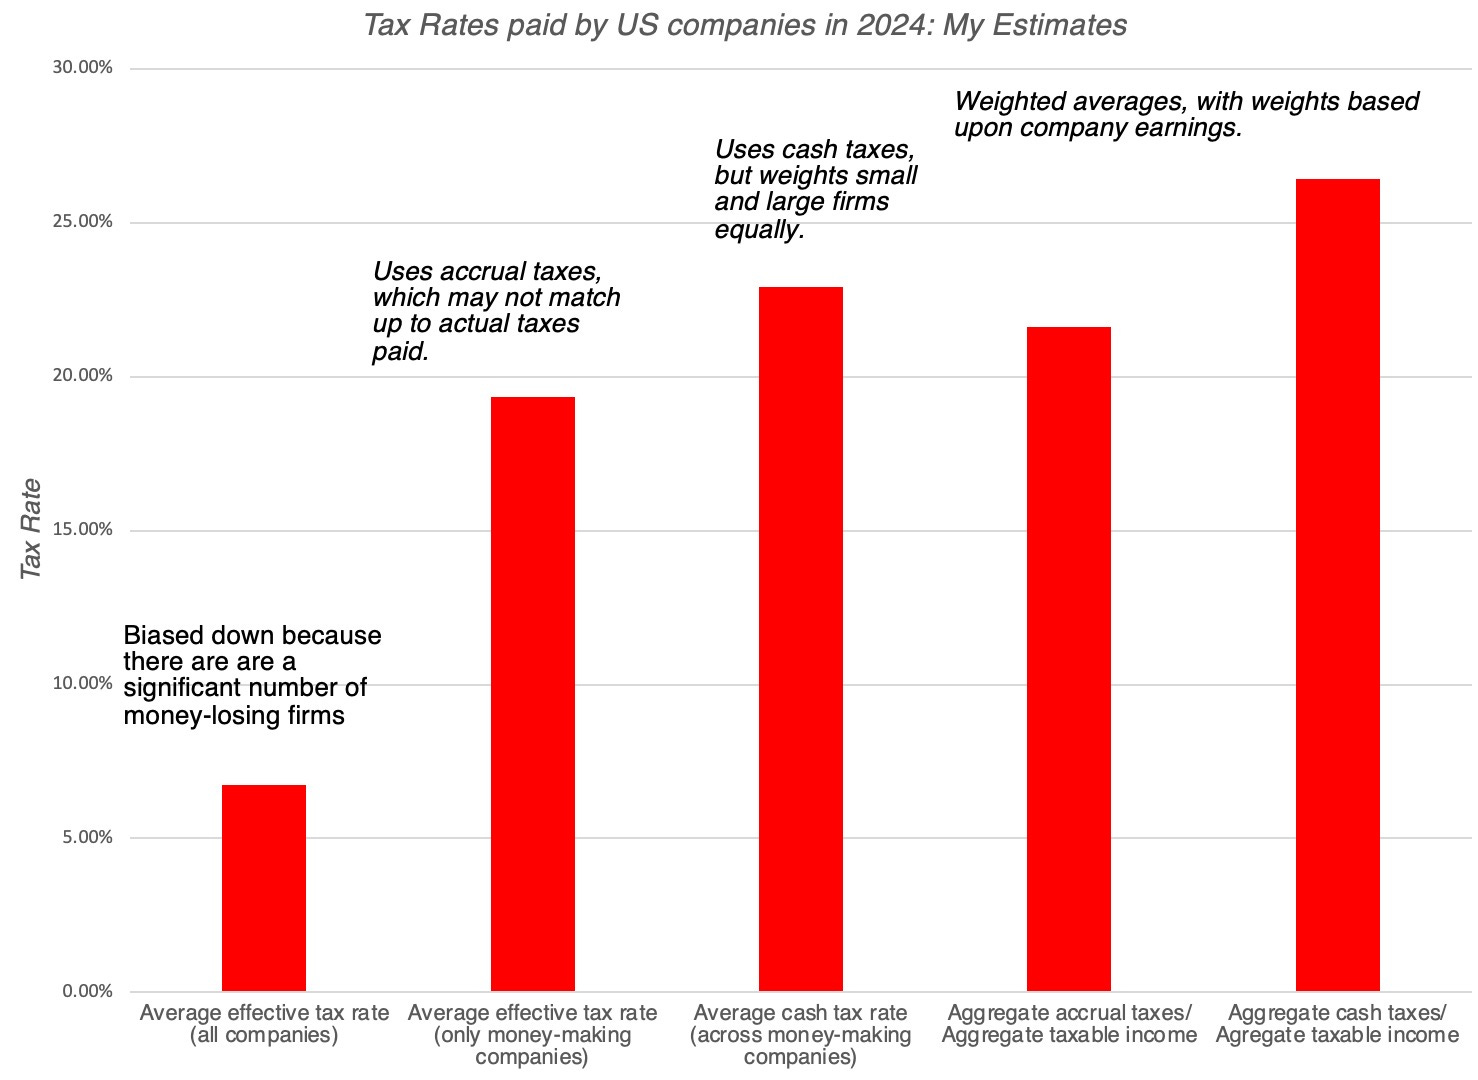
Data as a Truth Finder: Damodaran highlights how data can debunk myths, such as whether U.S. companies pay their fair share in taxes. His range of tax rates—from 6.75% to 26.43%, depending on calculation—shows how framing impacts conclusions.
Embracing Uncertainty: Unlike many experts, Damodaran stresses the importance of acknowledging uncertainty in predictions, noting that precise answers often hide significant noise.
Bias in Data Interpretation: Data isn’t inherently objective. As Damodaran demonstrates, analysts with biases can manipulate data to support preconceived notions, emphasizing the need for transparency and skepticism.
Supporting Evidence:
Last year’s U.S. tax rates demonstrate how data can be skewed by methodology: simple averages reflect 6.75%, but weighted averages rise to 23%-25%, depending on cash versus accrual methods.
The rise of U.S. equities—now 49% of global market cap, up from 42% in 2023—underscores the impact of sectoral dominance (e.g., tech at 30% of U.S. market cap) and challenges assumptions of mean reversion.
Historical data like P/E ratios often mislead when structural changes—such as global tech leadership or regional economic shifts—aren’t factored in, reinforcing the risks of overly simplistic analyses.
Bottom Line
Damodaran’s update is a masterclass in both the power and pitfalls of data. It challenges us to go beyond surface-level conclusions, embrace uncertainty, and carefully assess the context behind the numbers. For investors, the lesson is clear: data is a tool, not a shortcut to truth.
Full Article: https://aswathdamodaran.blogspot.com/2025/01/data-update-1-for-2025-draw-and-danger.html
💼 Market Indicators
SPY Performance

Performance and Valuations by Region
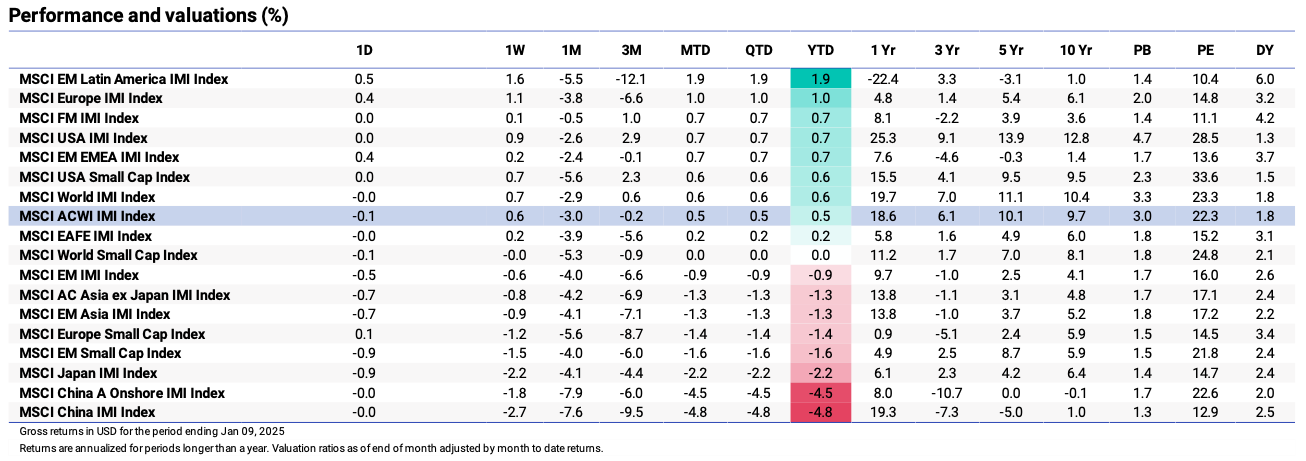
Source: MSCI
Momentum performance by Style
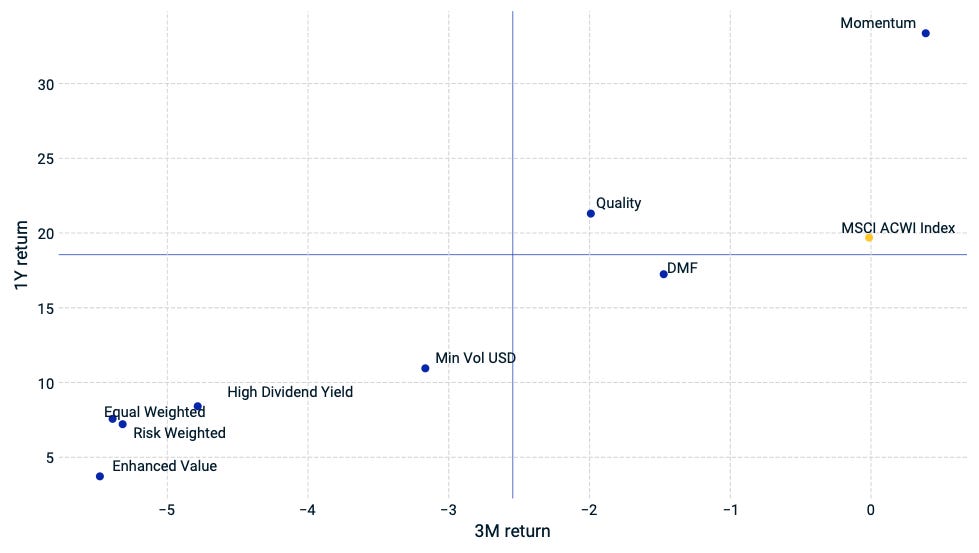
Source: MSCI
S&P 500 Earnings Per Share
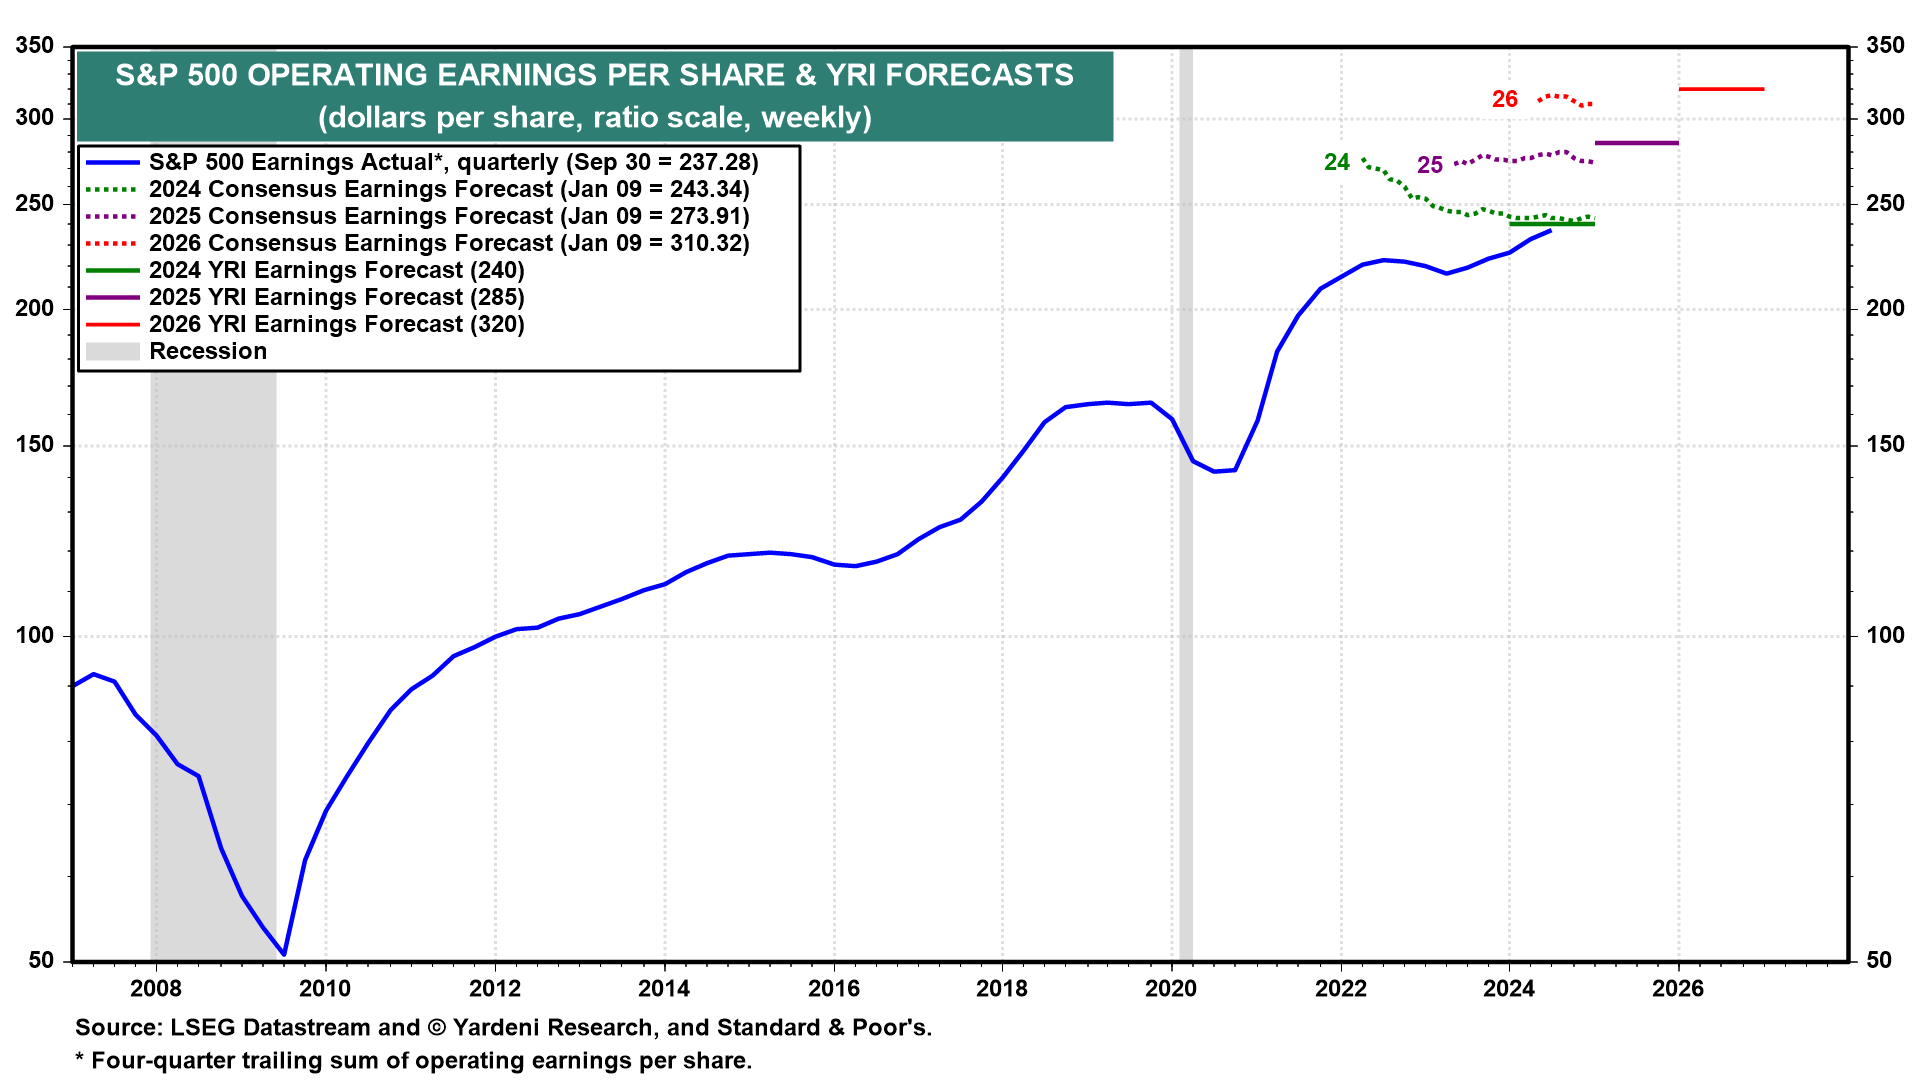
Source: Yardeni Research
🗺️ Around the World in Detail
🇺🇸 United States: Manufacturing Under Pressure
+256K Jobs Added: December’s blowout job growth beat expectations of 160K, keeping unemployment at a steady 4.1%. This reinforces the Fed’s hawkish stance, with rates likely staying elevated longer than markets hoped.
Treasury Yields Surge: The 10-year yield reached its highest level since November 2023, driven by strong labor market data and inflation concerns. Rising yields could weigh on equities and corporate borrowing costs.
Services PMI at 54.1: The expansion in December signals continued consumer demand, though rising input costs at 64.4 highlight persistent inflationary pressures. This complicates the Fed’s balancing act between growth and price stability.
🌐 International Markets: Diverging Paths
Canada 🇨🇦
Unemployment Drops to 6.7%: December saw 91K new jobs, with full-time employment surging. While a bright spot, weakening PMIs hint at softening growth, creating a tough landscape for the Bank of Canada as it eyes rate adjustments.
Services PMI Contracts to 48.2: Postal strikes and subdued demand led to the first contraction in two months. Export business took the biggest hit, signaling global headwinds for the Canadian economy.
Europe 🇪🇺
Inflation Rises to 2.4%: December’s uptick, driven by energy prices, challenges the ECB’s rate-cut optimism despite stable core inflation at 2.7%. The ECB may need to navigate growth concerns more cautiously.
Retail Sales Barely Budge: November’s modest +0.1% MoM increase reflects weak consumer momentum, with Germany and Spain recording declines. Economic activity remains fragile heading into 2025.
Japan 🇯🇵
JGB Yields Hit 1.19%: The highest level since 2011, tracking U.S. Treasury yields. Speculation about the Bank of Japan’s rate hike timing remains, with concerns over weaker real wages adding to the uncertainty.
Yen Weakens to 158/USD: A widening U.S.-Japan rate differential pressures the currency, raising risks of intervention by Japanese authorities.
🌏 Emerging Markets: Recovery and Risks
China 🇨🇳
Services PMI Climbs to 52.2: December’s improvement signals a boost from domestic demand, but persistent deflationary pressures—CPI at 0.1% YoY—cast a shadow over recovery efforts.
Producer Prices Down 2.3% YoY: Factory gate deflation extends to 27 months, emphasizing sluggish global demand and prompting continued government stimulus.
India 🇮🇳
GDP Growth Slows to 6.4%: A weaker fiscal year projection reflects slowing private investment and manufacturing output. Nonetheless, exports grew 5.9%, offering a silver lining for policymakers.
South Korea 🇰🇷
Muted Data Release: No major updates this week, but broader concerns over global tech demand could impact Korea’s semiconductor-heavy economy in the months ahead.
Taiwan 🇹🇼
Inflation Rises to 2.1%: December’s acceleration reflects higher food and housing costs, adding pressure on consumer wallets. However, subdued global demand continues to weigh on Taiwan’s export-driven economy.
🔑 Key Takeaway
This week's data underscores the delicate balance between economic resilience and market risks in 2025, while highlighting the complexities behind seemingly simple metrics. Strong U.S. job growth (+256K) and a resilient services sector (PMI 54.1) drove Treasury yields higher, reflecting inflationary pressures that keep the Fed cautious. Meanwhile, Europe’s inflation ticked up to 2.4%, complicating the ECB’s path toward rate cuts as growth signals weaken. In China, services PMI improved to 52.2, but persistent deflationary risks (CPI 0.1%) continue to weigh on recovery efforts.
Damodaran’s insights on data interpretation provide a crucial lens here: while headline numbers like job gains or inflation shifts dominate attention, understanding the biases and variability in these figures is essential. As the U.S.’s growing tech dominance (49% of global market cap) reshapes global markets, this week’s data reminds investors that regional contrasts and heightened uncertainty demand careful, nuanced analysis beyond surface-level metrics.
The content provided on MacroQuant Insights is for informational and educational purposes only and does not constitute financial advice. While every effort is made to ensure accuracy and reliability, all data, analysis, and opinions are based on sources believed to be trustworthy but are not guaranteed for completeness or timeliness. The views expressed are solely those of the author and do not reflect endorsements or recommendations for any specific investment, strategy, or action.
Investing involves inherent risks, including the potential loss of principal. Past performance is not indicative of future results. We strongly encourage readers to conduct their own research and consult with a qualified financial advisor or professional before making any financial decisions. MacroQuant Insights and its contributors disclaim all liability for investment decisions based on the information provided and make no warranties regarding the content’s accuracy or reliability.
Remember, all investments carry risks, and it is essential to understand these risks fully before acting on any information presented. Users are responsible for their own investment decisions. MacroQuant Insights assumes no responsibility for any outcomes resulting from the use of this information. Content is subject to change without notice.